Saturday, January 31, 2015

Calculate for GDP

  • Budget = government purchases of goods and services + government transfer payments - government tax and fee collection
    • + (positive) numbered budget = deficit
    • - (negative) numbered budget = surplus
  • GNP = GDP + Net Foreign Factor Income
  • NNP (net national product) = GNP - depreciation
  • NDP (net domestic product) = GDP - depreciation
  • National income
    1. GDP - indirect business taxes - depreciation - Net Foreign Factor Payment
    2. compensation of employees + proprietor's income + corporation profits + rental income + interest income
  • Disposable Personal Income (DPI) = National Income - personal household taxes + government transfer payments
  • Trade = Export - Import

  • Nominal GDP -
    • value of output produced in current prices
  • Real GDP -
    • value of output produced in constant or base (earliest year) year prices
    • adjusted for inflation
    • can only increase from year to year if output increases
  • Product x Quantity = normal/real GDP
  • Price Index - measures inflation by tracking changes in the market basket of goods
    • (price of market basket of goods in current years/ price of market basket of goods in base years) x 100
  • GDP Deflator - a price index used to adjust from nominal to real GDP
    • (nominal GDP/real GDP) x 100
  1. base year, GDP is always equal to 100
  2. years after base year, GDP deflator is > 100
  3. years before base year, GDP deflator is < 100
  • Inflation Rate -
    • (new deflator - old deflator/old deflator) x 100

Gross Domestic Product (GDP) and Gross National Product (GNP)

GDP - most important measure of growth.

- Production within that year
- National Income Accounting - statistics that Economists collect on production, income, investment, and savings
- gross = total before adding taxes
GDP : 
  • Total dollar value of all final goods and services produced within a country's borders within a given year
  • What is not included in GDP?
    • Intermediate goods
      • no multiple counting
      • only counts for final goods
    • Secondhand or Used Goods
      • if bought from someone else
      • already counted for the year it was made
    • Non-market Activity
      • illegal drugs
      • babysitting
      • volunteering
      • unpaid position, doesn't count
    • Financial Transaction
      • stocks
      • bonds
      • real estate
    • Gifts or Transfer Papers
      • social security
      • scholarships
  • What is included in GDP?
    • C - Consumption
      • 67% of economy
      • all finished goods and services
    • Ig - Gross Private Domestic Investment
      • new factory equipment
      • new housing
      • new factory equipment maintenance
      • unsold inventory of production built in a year
    • G - Government Spending
      • government purchase of goods and services
    • Xn - Net Exports
      • Exports - Imports (minus)
  • Expenditure Approach -
    • C + Ig +G + Xn =GDP
    • add up market value of all domestic expenditures made on final goods and services in a single year
      • what is bought or sold
Proof of GDP is found in receipts, GDP is more reliable than GNP.

Gross National Product (GNP) :
  • total value of all final goods and services by citizens of that country on its land or on foreign land
    • ex: Nike's, made by foreigners and sold somewhere else
  • Income Approach -
    • GDP = W + R + I + P + Statistical Adjustments
      • W = wages
        • compensation of employees, salary supplements
          • ex: pension (retirement), health, insurance, welfare)
      • R = rents
        1. tenents to landlord
        2. lease payment by a corporation for use of space
      • I = interest
        • money paid by private businesses to the suppliers of loans used to purchase capital
      • P = profits, corporation profit
        1. Corporation income taxes could show up as dividends, or undistributed corporation profits
    • add up all of the income earned by households and firms in a single year
      • this is what you report
      • is based on what you say
      • not reliable

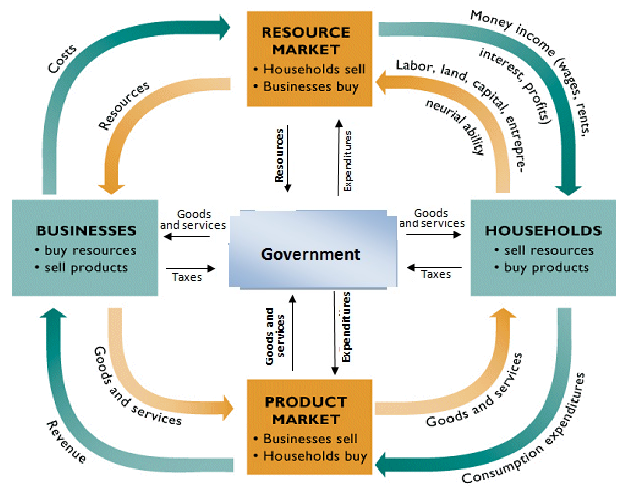
Circular Flow Diagram

Circular Flow Diagram -
  • represents transaction in an economy (ex: like the market)


Economic -

  1. Household : person/group that shares income
  2. Government :
  3. Firm : organization that produces goods and services for sale
Market - 
  1. Resource/Factor : place where household sells resources and businesses buy resources
  2. Product : place where goods and services are produced by businesses and both are sold by household

Tuesday, January 20, 2015

The Business Cycle


  • Expansionary - the real output in the economy is increasing and the unemployment rate is declining
    • ex : we can tell the stage of expansionary when houses are being built, gas prices are dropping
  • Peak - where real GDP is at its highest point
  • Contraction (Contractionary) - the real output in the economy is decreasing and the unemployment rate is rising/increasing
    • also known as a recession
  • Trough - lowest point of real GDP
    • trough means that the graph curves downward real deep
    • a depression (unless GDP seriously dropped)
    • one business cycle goes from trough to trough
    • Average cycle is 6 years
    • Recessing last about 14 months
    • Bulk of a cycle is the growth stage

  • Peak - Trough, are meaningless because we never know we are in one until it's over
  • If a recession loses more than 10% of real GDP, then it's a depression
  • Trough means the end of a recession

Monday, January 19, 2015

Demand and Supply (Graph)

Graph shows the relation between Supply and Demand:

  • Equilibrium - it is the point at which the supply curve and the demand curve intersect
    • means all resources are being used efficiently
  • Shortage - QD > QS
    • Quantity of demand is greater than the quantity of supply
    • excess demand
  • SURPLUS - QS > QD
    • Quantity of supply is greater than the quantity of demand
    • excess supply

Graph shows a Price Floor
  • Price Floor - a government price control on how low a price can be charged for a product
    • ex : minimum wage


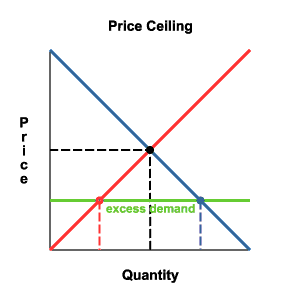
Graph shows a Price Ceiling
  • Price Ceiling - a government imposed limit on how high a price is charged
    • ex : rent control

Thursday, January 15, 2015

Demand and Supply (Supply)

  • Supply Schedule - when the price increases, the quantity increases
  • Supply Curve -
  • Supply is quantities that producers or sellers are willing and able to produce or sell at various prices
  • The Law of Supply - direct relationship between price and quantity supplied PQ
    • ex: P↑ Q
    • ex: P↓ Q
  • What causes a "change in quantity supplied"?
    • ∆ in price
  • What causes a "change in supply"?
    1. ∆ in technology
    2. ∆ in taxes or subsidies
    3. ∆ in the number of sellers
    4. ∆ in the resource prices or cost of production
    5. ∆ in weather
    6. ∆ in expectations

Monday, January 12, 2015

Demand and Supply (Demand)

  • Demand Schedule - when prices decrease, the quantity increases
  • Demand Curve :


  • Demand is the quantities that people are willing and able to buy at various prices
    • ex: when there are doughnut on sale and people really want them, even when prices go up, doughnut-lovers will still go out to buy them
  • The Law of Demand - an inverse relationship between price and quantity demanded
    • ex: P Q↓ (price goes up, quantity goes down)
    • ex: P↓ Q↑ (price goes down, quantity goes up)
  • What causes a "change in quantity demanded"?
    • ∆(change) in price
  • What causes a "change in demand"?
    1. ∆ in buyer's taste -
      • advertising
    2. ∆ in the number of buyers -
      • population
    3. ∆ in income -
      • normal goods - goods that buyers buy more of when income rises
      • inferior goods - goods buyers buy less of when income rises
    4. ∆ in prices of related good -
      • substitute goods - goods that serve roughly the same purpose
      • complementary goods - goods that are often consumed together
    5. ∆ in expectations -
      • what happens in the future
Elasticity of Demand:
  1. Elastic Demand - tells how drastically buyers will cut back or buy more of a particular good
    • product that is elastic when demand will change drastically given a small price
    • ex: wants for steak, a fur coat
    • E > 1
  2. Inelastic Demand - a product is inelastic if demand will not ∆ regardless of price
    • ex: needs for milk, gasoline, medicine (insulin)
    • E < 1
  3. Unit Elastic -
    • ex: salt
    • E = 1
Let's say someone was selling cookies for $4 a dozen and was able to sell 50 dozens. This person increases the price to $6 a dozen and was able to sell 40 dozens. Here's how to find the Elasticity of Demand:
  1. % ∆ in quantity :
    • (new quantity - old quantity) / old quantity
    • ex: (40 - 50) / 50 = -.20
  2. % ∆ in price :
    • (new price - old price) / old price
    • ex: ($6 - $4) / $4 = .5
  3. Price Elasticity of Demand (PED) :
    • -.2 / .5 = .4 , which makes it inelastic
  • When calculating for PED, take the absolute value of the ∆Q's and ∆P's because E cannot be a negative number.

Thursday, January 8, 2015

Production Possibility Curves

Production Possibility Curves/Frontier - shows the most that society can produce if it uses every available resource at the best of its ability


  • Productive Possibility Graph:


  • Point A : is efficient but produces more capital goods
  • Point B : is efficient or attainable
  • Point C : is efficient but produces more consumer goods
  • Point D : is a attainable but inefficient, it under utilizes its resources
    1. decrease in population
    2. underemployment or unemployment
    3. wars or famine
  • Point E :  is the region of being unattainable
    1. Technological Improvement
    2. Economic Growth
    3. Discovering New Resources
Key Assumptions:
  1. Two goods are produced
  2. Full Employment (FE)
    • not 100% employment
    • not 100% productive
    • approximately 4-5% employment
    • approximately 80% factory capacity
  3. Fixed resources
    1. land
    2. labor
    3. capital
  4. Fixed state of technology
  5. No international trade

Macroeconomics

  • Macroeconomics - the study of major components of economy
    • ex : inflation, supply and demand, wages, GDP
  • Microeconomics - the study of how households and firms make decisions and how they interact with the market
    • ex : supply and demand, market structure, businesses

  • Positive Economics - claims that attempt to describe the world as it is, very descriptive and fact based
    • ex : minimum wage laws cause employment
    • reduction in force if there is an increase in minimum wage
  • Normative Economics - claims that attempt to predict or prescribe how the world should be, opinion based
    • ex : government should raise minimum wage
    • TX - $7.25; if wage increases, the living cost increases as well

  • Needs - basic requirements for survival
    • ex : food, water, shelter
  • Wants - desires of citizens, broader than needs

  • Scarcity - limited
    • fundamental economic problem that all societies face
    • satisfy unlimited wants with limited resources
      • ex : water, oil
  • Shortage - situation where quantity demanded is greater than quantity supplied
    • ex : when a place doesn't have what you want/need, so they go out to get more of is so they can satisfy you and keep you as their customer

  • Goods - tangible commodity; bought, sold, traded, produced
    1. Consumer Goods - goods that are intended for final use by the consumer
    2. Capital Goods - items used in the creation of other goods such as factoring machinery and trucks
  • Services - work that is performed for someone else
    • ex: a Barber
Factors of Production :
  1. Land - natural resources
  2. Labor - work force
  3. Capital -
    • Human Capital - knowledge and skills a worker gains through education and experience
      • ex : training on the job or in college
    • Physical Capital - human-made objects used to create other goods and services
      • ex : buildings and tools, factories
  4. Entrepreneurship - product, inventive, and a risk-taker

  • Trade-Offs - alternatives that we give up when we choose one course of action over another
    • ex : there's no such thing as a free lunch
  • Opportunity Cost - choosing the next best alternatives
    • will exist as long as resource scarcity exists due to our endless wants and needs
    • ex: choices you make when you don't get your first choice