Sunday, May 3, 2015

Absolute and Comparative Advantage

Absolute Advantage 

  • individual - exists when a person can produce more of a certain good or service than someone else in the same amount of time
  • national - exists when a country can produce more of a goods or service than another country can in the same time period
  • faster and more efficient ( time-wise )
Comparative Advantage 
  • individual / national - exists when an individual or nation can produce a goods or service at a lower opportunity cost than can another individual or nation
  • lower opportunity cost
  • production
- lower opportunity cost is GOOD

Purchasing Power Parity


  • when currency rates are set by international markets, changes will be based on neutral purchasing power of currencies
  • U.S. $ to European Euro is 1.5 : 1
    • each $1.50 will buy 1euro, however if an item in the U.S. cost $1.50 and then cost more / less than 1euro, the parity is lost
      • markets will adjust quickly in floating rates, or pressure for change will occur in fixed rates
Reasons we Exchange Currencies
  1. to sell export and buy imports
  2. to invest in another country's stocks and bonds
  3. build stories or factories in another country
  4. speculate on currency values
  5. to hold currencies in bank accounts for future exports / imports/ business loans
  6. control excessive imbalances

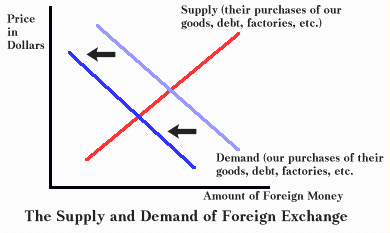
Foreign Exchange ( FOREX )

  • buying / selling of currency
    • ex : in order to purchase souvenirs in France, 1st recession for American to sell ( supply ) their dollar and buy ( demand ) Euros
  • exchange rate is determined in the foreign currency markets
    • ex : currency exchange rate is approximately 77 yen to 1 U.S. dollar
  • simply put, exchange rate is price of currency
  • do not try to calculate exact exchange rate
  • ALWAYS change the demand line on one currency graph, the supply line on the other economy's graph
  • MOVE the lines on the two currency graphs in the same direction ( R or L ) and you will have the correct answer
  • IF demand on the other graph increases, supply on the other will also increase
  • IF demand moves to the L, supply will move to the L on the other graph
Changes in Exchange Rates
  • exchange rates are a function of the supply and demand for currency
    • increase in supply of currency will make it cheaper to buy one unit of the currency
    • decrease in supply of currency will make it more expensive to buy one unit of that currency
    • increase in the demand of currency will make it more expensive to buy one unit of that currency
    • decrease in the demand of currency will make it cheaper to buy one unit of that currency
Appreciation
  • appreciation of a currency occurs when the exchange rate of that currency increases
    • hypothetically : 100 Yen used to buy $1, now 200 Yen to buy $1
      •  dollar is "stronger" because one buys more Yen than it used to
Depreciation
  • depreciation of currency occurs when the exchange rate of that currency decreases
    • hypothetically : 100 Yen used to buy $1, now 50 Yen buys $1
      • dollar is weaker because it takes fewer Yen to buy $1
- extra -
  • Supply of money : comes from U.S. citizens, banks, and industries wanting to purchase government investments and assets
    • making transfer payments to foreigners
  • Demand of money : comes from foreigners making transfer payments to the U.S.
Dollar Appreciation :
  • each dollar gets you more of the other currency
  • U.S. exports gets more expensive for foreigners
  • U.S. imports gets cheaper for us
  • dollar leaving U.S.
  • exports decrease
  • imports increase
  • Net exports decrease
  • GDP decreases
  • demand of dollar increases
  • supply of dollar decreases
Dollar Depreciation :
  • each dollar gets you less of the other currency
  • less of foreign currency is needed to get dollar
  • exports increase
  • imports decrease
  • money either enters U.S. :
    • Net exports increase
    • GDP increase
    • Demand of dollar decreases
    • Supply of dollar increases
On the Graph, it is inverse between demand and supply, but they move in the same direction between increase or decrease.


Balance of Payments ( 2 )

Assets or CREDITS ( + ) , Demand for $ , "Inflows"

  • Current Accounts :
    • Balance on Goods and Services
    • Net Exports ( Xn )
    • Balance of Trade
      • Exports ; tourism Here ( ex : Disney World )
    • Net Investments
      • interest / dividend payments foreigners paid to U.S. for the use of exported capital
    • Net Transfers
      1. Aid to U.S.
      2. Transfer back to U.S.
      3. Royal ties 
        • ex : wrote a song, but other people use it ( copyright )
  • Capital / Financial Accounts :
    1. Capital / Inflows
    2. Direct investment in the U.S. by foreigners
    3. Purchase of stocks and bonds by foreigners
    • Official Reserves
      1. Currencies
      2. IMF ( international monetary funds ) Holdings
      3. Gold
Liabilities or DEBITS ( - ) , Supply of $ , "Outflows"

  • Current Accounts :
    • Balance on Goods and Services
    • Net Exports ( Xn )
    • Balance of Trade
      • Imports ; tourism There ( ex : Paris )
    • Net Investments
      • interest / dividend payments the U.S. made for the use of foreign capital invested in the U.S.
    • Net Transfers
      1. Aid to Them
      2. Remittance from the U.S.
      3. Their Royalties
  • Capital / Financial Accounts :
    1. Capital / Outflows
    2. Direct investment in the U.S. over There
    3. Purchase of stocks and bonds by the U.S.
  • Official Reserves
    1. Currencies
    2. IMF ( international monetary funds ) Holdings
    3. Gold
Balance Trade :
  • goods and service EXPORT - goods and service IMPORT
Trade Deficit when balance on trade is negative :
  • more import than export
Trade surplus occurs when balance of trade is positive :
  • more export than import
Current Account :
  • balance of trade + net investment + net transfer
Capital Account :
  • foreign purchase of you country's asset + your country's purchase of assets abroad
Official Reserves ( ALWAYS POSITIVE )
  • Current Account + Capital Account
Balance of Goods and Service :
  • goods import + services import
Balance of Trade :
  • goods export + goods import

Balance of Payments


  • measure of money inflows and outflows between U.S. and Rest of the World ( ROW )
  • system of accounting used for international trade
  • credit ( in ) and debit ( out )
  • inflow ( adding ) and outflow ( subtracting ) from account
3 Accounts
  1. Current Account
  2. Capital / Financial Account
  3. Official Reserves Account
Double Entry Bookkeeping
  • every transaction in the balance of pavements is recorded twice in accordance with standard accounting practice
    • ex : always = 0 ; offset each other and should = 0 ( theoretically )
    • ex : John Deere export $ 50 million
      • credit $ 50 million to current account
      • debit $ 50 million to capital / financial account
Current Account
  • balance of trade or net exports
    • exports of goods and services - imports of goods and services
    • exports create a credit to balance of payments
    • imports create a debit to balance of payments
  • Net Foreign Income
    • income earned by U.S. owned foreign assets - income paid to foreign held U.S. assets
      • ex : interest payment to U.S. owned Brazilian bonds - interest payment to German owned U.S. Treasury bonds
  • Net Transfer ( tend to be unilateral )
    • foreign aid  a debit to the current account
      • ex : Mexican migrant workers send money to family in Mexico
Capital / Financial Account
  • balance of capital ownership
  • includes purchase of both real and financial assets
  • direct investment in U.S. is a credit to the capital account
    • ex : Toyota Factory in San Antonio
  • direct investment by U.S. firms / individuals in a foreign country are debits to the capital account
    • ex : Intel Factory in San Jose, Costa Rica
  • Purchase of Foreign financial assets represent debit of capital account
    • ex : Warren Buffet buys stocks in Petrochina
  • Purchase of domestic financial assets by foreigners represent a credit to the capital account
    • ex : United Arab Emirates Sovereign Wealth Fund purchases a large stake in NASDAQ
Relationship between Current and Capital Account?
  • Current and Capital Account MUST = 0 ( or cancel each other out )
  • if the current account has a negative balance ( deficit ) , then the capital account should then have a positive balance ( surplus )
    • ex : the constant net inflow of foreign financial capital to the U.S. ( capital account surplus ) is what enables us to import more than when we export ( current account deficit )
Official Reserves ( encompassing gold and reserves )
  • foreign currency holdings of the U.S. Federal Reserves System
  • when there is a balance of payments surplus the FED accumulates foreign currency and debits the balance of payments
  • when there is balance of payments deficit the FED depletes its reserves of foreign currency and credits the balance of payments
Active v.s. Passive Official Reserves
  • U.S. is passive in its use of official reserves
    • it does not seek to manipulate the dollar exchange rate
  • the People's Republic of China is active in its use of official reserves
    • it actively buys and sells dollars in order to maintain a steady exchange rate with the U.S.

Economic Growth and Productivity ( 2 )


  • Economic Growth Defined
    • sustained increase in real GDP over time
    • sustained increase in real GDP per capita over time
  • Why Grow?
    • growth leads to greater prosperity for society
    • lessens the burden of scarcity
    • increases the general level of welbeing
  • Conditions for Growth
    • Rule of Law
    • Sound Legal and Economics Institutions
    • Economic Freedom
    • Respect for Private Property
    • Political and Economic Stability
      • low inflationary expectations
    • Willingness to sacrifice current consumption in order to grow
    • Saving
    • Trade
  • Physical Capital
    • tools, machinery, factories, infrastructure
    • physical capital is the product of investment
    • investment is sensitive to interest rates and expected rates of return
    • it takes capital to make capital
    • capital must be maintained
  • Technology and Productivity
    • research and development, innovation and invention yield increases in available technology
    • more technology in the hands of the workers increases productivity
    • productivity is out per worker
    • more productivity = economic growth
  • Human Capital
    • people are a country's most important resource, therefore human capital must be developed
    • education
    • economic freedom
    • the right to acquire private property
    • incentives
    • clean water
    • stable food supply
    • access to technology
  • Hindrances to Growth
    • Economic and Political Instability
      • high inflationary expectations
    • abscence of the Rule of Law
    • diminished private property rights
    • negative incentives
      • welfare state
    • lack of savings
    • excess current consumption
    • failure to maintain existing capital
    • Crowding Out of Investment
      • government deficits and debt increasing long term interest rates
    • increased income inequality
      • Populist policies
    • restrictions on Free International Trade

Supply - Side Economics


  • Supply - Side Economists tend to believe that the AS curve will determine levels of inflation, unemployment, and economic growth
  • to increases economy, you take actions to  shift the AS curve to the right, always benefiting the company first
    • focus on marginal tax rates
      • Marginal Tax Rates - the amount paid on the last dollar earned or on each additional dollar
    • believe that if reduce marginal tax rate, it would encourage more people to work longer in which they would forgo their leisure time for extra income
    • lower taxes are incentives for businesses to invest in our economy
    • lower taxes are incentives for people to increase savings and therefore create lower interest rats for increases in business investment
    • Reaganomics ( another name for Supply - Side Economics )
Laffer Curve - trade - off between tax rates and government revenue
  • used to support Supply - Side argument
  • tax revenue increases from 0 to some max level then declines as tax rates increase from 0 then.... ( it's a cycle )
  • opportunity cost, choose best option to go for
  1. research suggest that the impact of tax rates on incentives to work, save, and invest are small
  2. tax cuts also increase demand, which can fuel inflation, which will cause demand to exceed supply
  3. where the economy is actually located on the curve is difficult to determine
Reaganomics - used to get out of recession
  • lower marginal tax rates to get U.S. out of a recession led to a deficit
  • Clinton raised marginal tax rate, led to surplus

Phillips Curve

- relationship between unemployment and inflation
- tradeoff only occurs in the short run ( time too short to adjust to price level )

  • Long Run PC ( Phillips Curve )
    • occurs at natural rate of unemployment
    • represented by a vertical line
    • no trade off between unemployment and inflation
    • only shifts if LRAS curve shift
    • major assumptions is that more worker benefits creates more natural rate and lower worker benefits creates natural rate
3 Types of Natural Unemployment ( FE)
  1. Structural, need update
  2. Frictional, in between jobs
  3. Cyclical, only available at certain seasons
-Cyclical NOT because the economy fluctuates, not natural

Short Run PC
  • relevance to Okun's Law
  • inverse relationship between unemployment and inflation rate
    • inflation ↓ unemployment 
    • inflation  unemployment 
    • high inflation = low unemployment
    • low inflation = high unemployment
  • aggregate supply shocks can cause both rate of inflation and unemployment to increase
Supply Shocks
  • rapid and significant increase in resource cost, which will cause SRPC to shift
  • wages are stick, inflation changes, moves points on SRPC
  • if inflation persists and expected rate of inflation rises, then entire SRPC moves upward, which creates a situation called stagflation
  • if inflation expectations drops due to new technology, then SRPC will move downward
Stagflation, high unemployment AND high inflation simultaneously
  • BIG PROBLEM
Misery Index
  • combination of inflation and unemployment in a given year
  • single digit misery is good
Inflation = 2 - 3 %
Unemployment = 4 - 5 %
- these are good percentages

Long Run Phillips Curve ( LRPC )
  • because LRPC exists at the natural rate of unemployment, structural changes in the economy that affect unemployment, will also cause LRPC to shjift
    • increase in natural unemployment, shift 
    • decrease in natural unemployment, shift 
Phillips Curve relating to AD / AS
  • changes in AD / AS can also be seen in Phillips Curve
  • easy way to understand how changes in AD / AS affect Phillips Curve is to think of the two sets of graphs as mirror images
  • 2 models are not equivalent, AD / AS model is static, but Phillips Curve includes changes over time whereas AD / AS shows one time changes in price level as inflation / deflation
    • Phillips Curve illustrates continuous change in price level as either increase inflation / deflation
Increase AD = up / left movement SRPC

Stagflation - situation where you have high inflation and high unemployment at the same time

Disinflation - reducing in inflation value from year to year, which is usually displayed in LRPC
- decrease in inflation rate
- occurs when AD declines
- in SRPC, profits fall and unemployment rate increases

Deflation - actual drop in the price level


SRPC meet with LRPC at NRU ( natural rate of unemployment )
  • graph relates inflation with unemployment = Phillips Curve
  • disinflation = inflation decrease ( ex : 8 , 4 , 2 )
  • cost - push inflation
  • high inflation with high unemployment = stagflation
  • economists call the knowledge and skills that make the workers productive = Human Capital
Economic Growth and Productivity


  • Long - Run Economic Growth, Phillips Curve, and Laffer Curve
    • focus on real GDP per capita
    • last 50 years real GDP grew by about 3.5 % per year
    • last 50 years real GDP per capita grew by about 2.3 % per year
  • Sources of Long - Run Growth
    • Productivity, output per unit of input
    • Labor Productivity, output per worker
    • What leads to higher productivity?
      • Stock of Physical Capital - buildings, machines, robots, etc.
      • Human Capital - knowledge, sills, education, etc.
      • Technology - technical means for producing goods and services
      • Improved Resources Allocation - trade allows us to shift labor services from low - productive jobs to high productive jobs
      • Economics Of Scale - reduction in per - unit cost that results from increases in size of markets and firms
  • Production Possibilities Curves and LRAS :
    • Economic Growth : shift in PPC outward
    • Economic Growth : shift in LRAS Curve to the RIGHT
  • Why Growth Rates Differ Among Countries :
    • Rates of Savings
    • Foreign Investment
    • Education
    • Infrastructure : roads, power lines, ports, and informative networks, etc.
    • Research and Development
    • Political Stability
    • Protection of Property Rights
    • Economic Freedom v.s. Excessive Government Intervention
  • The Phillips Curves - Short and Long Run
    • tradeoof between inflation and unemployment
    • stagflation leads to shifts in the SRPC
    • Aggregate Supply Shocks :
      • Oil Embargo
      • Major Agriculture Shortfalls
      • Depreciating U.S. Dollar
      • Wage Hikes
      • Inflationary Expectations
    • Long - Run Phillips Curve (  LRPC )
      • vertical line at the natural rate of unemployment
  • Supply - side Economics and the Laffer Curve
    • stress that changes in the Aggregate Supply are an active force in determining the levels of inflation, employment, and economic growth
    • concentrate on tax levels
    • lower taxes are an incentive for business to invest in our economy
    • lower taxes are an incentive for workers to work more and harder, thereby becoming more productive
    • lower taxes are incentives for people to increase savings and therefore create lower interest rates for increases in business investment
    • focus on marginal tax rates
  • The Laffer Curve
    • relationship between tax rates and tax revenues
    • used to support the supply - side arguement
    • Reaganomics = Supply - Side Economics
    • Ideas = government could lower tax rates and actually increase tax revenues
    • has been severely criticized

Saturday, March 28, 2015

Blog Assignment on Unit Four Videos

First Video : http://www.youtube.com/watch?v=YLsrkvHo_HA&feature=results_video&playnext=1&list=PL2CB281D126F65E26
  • Commodity money are goods that have other purposes that allow for trade, representative money are thinks like the gold system that backs the money, and then there is fiat money, which is money that is accept because the government says it is money. These are the types of money. The functions of money are to act as medium of exchange, to store value, and to be a unit of account. By being a unit of account, it allows us to judge what something is worth in terms of value or quantity.

Second Video : http://www.youtube.com/watch?v=gzFdeM6lUno&feature=bf_prev&list=PL2CB281D126F65E26&lf=results_video
  • In the money market, in terms of money, the price paid for or to get money is the interest rate, which is the y-axis on the money market graph. On the x-axis, it is the quantity of money. Demand for money will always slow down, because when prices are increased, the quantity of demand will decrease meaning the interest rate will decrease, allowing for people to borrow more. The supply of money will always be vertical, because it doesn't vary upon interest rate, it is fixed and set by the Fed. The Fed will always want to stabilize interest rate because if it is unstable, then they cannot predict the level of investment or consumer spending that will help manipulate AD to give us the kind of economy we want.

Third Video : http://www.youtube.com/watch?v=XJFrPI8lLzQ&feature=bf_next&list=PL2CB281D126F65E26&lf=results_video
  • What the Fed does to manipulate money supply is either increase or decrease required reserves, discount rate, or the buying or selling of bonds and securities. Required reserves is the percentage of total bank deposit that the bank has to hold on to. Discount rate is the rate at which banks can borrow money from the Fed overnight. The buying and selling of bonds affects the money supply, because if the government buys bonds, the public gets the money and thereby this increases the money supply. On the other hand, if the government sells bonds, the public will buy it and so the Fed keeps the money, causing the money supply to decrease.

Fourth Video : http://www.youtube.com/watch?v=rdM44CC0ELY&feature=bf_next&list=PL2CB281D126F65E26&lf=results_video
  • Loanable Funds is the money available in the banking system for the people to borrow from. if the interest rate is down then there is more demand in the money, whereas if it is increased, the demand for money would be lower. The supply of loanable funds comes from the amount of money the people have in their bank, which is dependent on savings. Even though in the AD/AS graph, savings is a leakage, in LF, savings is good because the more money people save, the more money banks have to loan out, thereby increasing the money supply.

Fifth Video : http://www.youtube.com/watch?v=1tUC59pz95I&feature=bf_next&list=PL2CB281D126F65E26&lf=results_video
  • In the money creation process, banks create money by making loans from their excess reserves. The less that's in the required reserves there are, the more excess reserves there will be. Because there is more excess reserves, more money can be lent out to people. By lending out more money, the money supply would increase. If banks keep a portion of their excess reserves, it would reduce the total amount in the money supply

Sixth Video : https://www.youtube.com/watch?v=k37Y6BKcpsY&index=8&list=PL2CB281D126F65E26
  • There is a connection between the money market, loanable funds market, and the AD/AS graph. Let's say the government is experiencing a deficit. In order to fix it, they decide to borrow more money. In doing so, the demand for money is increased in the money market graph as well as the demand for loanable funds in the loanable funds graph. Aggregate demand would increase in the AD/AS graph. Each market experiences an increase from the demand side. The change in the supply of money implies a change in prices. The Fisher Effect tells us that if there is an increase in interest rate, then the price level would go up as well.

Countercyclical Fiscal Policy

Fighting a Recession :
  • Policy Name = Expansionary
  • Taxes = cut, decreased, lowered
  • Government Spending = increase
  • Budget Result = deficit
Aggregate Model :
  • C should = increase
  • G should = increase
  • AD should = increase
Money Market :
  • DM will = increase
  • i should = increase
  • ( Ig on Aggregate Model will ) = go down
Loanable Funds Market :
  • The budget issue will cause
    • SLF = decrease
    • DLF = increase


Fighting a Inflation :
  • Policy Name = Contractionary
  • Taxes = increase
  • Government Spending = decrease
  • Budget Result = surplus
Aggregate Model :
  • C should = decrease
  • G should = decrease
  • AD should = decrease
Money Market :
  • DM will = decrease
  • i should = decrease
  • ( Ig on Aggregate Model will ) = go up
Loanable Funds Market :
  • The budget issue will cause
    • SLF = increase
    • DLF = decrease


Monetary Policy ( Recession ) :
- The Fed will :
  1. buy bonds  MS ↑ ( bank reserves will  as  well )
  2. lower discount rate
  3. lower required reserves
  4. lower federal fund rate
  • MS 
  • Ig 
  • AD 
  • GDP 

International Trade :
- Fiscal Policy :
  • D$ 
  • $ appreciate
  • Export 
  • Net Export 
  • AD 
  • GDP 
- Monetary Policy ( continuing from the Recession section above ) :
  • D$ 
  • $ depreciate
  • Export 
  • Net Export 
  • AD 
  • GDP 

Crowding Out

What is Crowding Out ?

  • A critique and flaw of Keynesian policies that are applied to fight a recession
    • expansionary policy
Why does it happen ?
  • The policy of cutting taxes and raising spending will create a budget deficit
So ?
  • The budget deficit must be funded and to do this Congress orders the sale of U.S. bonds
    • NOT a Monetary Policy tool used by the Fed
This money comes from ?
  • Mostly from U.S. citizens, companies, and investment firms
Therefore ?
  • Money that could be spent on consumption or used for private savings is now being used to buy bonds
On the Money Market ?
  • This will cause the money demand curve to shift outward
    • this is a Fiscal event
On the Loanable Funds Market ?
  • This will cause the supply curve to shift inward because we are not saving money privately anymore
  • It can also cause the demand curve to shift outward because the private and public demand for money increases
On both graphs ?
  • The nominal and real interest rates will increase
Therefore on the Investment D graph
  • The increase in nominal and real interest rates will cause Ig to decrease
Is this counterproductive ?
  • Yes
Then why do it ?
  • Fiscal Policy supporters ( Keynesians )insist that gains in Consumption and Government Spending will outweigh any losses in future Gross Private Investment
Why ?
  • Consumption and Government Spending are greater than Gross Private Investment and they are short run improvements
  • Gross Private Investment is long run and Keynesians don't worry about that
  • In the long run, we are all dead
Anymore ?
  • This is summarized on the Aggregate Model
  • AD will move outward due to the increase in Consumption and Government Spending and then "maybe" move inward due to a loss of Gross Private Investments , but not as much as the increase
  • Economy Improves

Loanable Funds Market

  • market where savers and borrowers exchange funds ( QLF ) at real rate of interest ( r % )
  • demand for loanable funds, or borrowing, comes from households, firms, the government, and foreign sector
    • demand for loanable funds is in fact the supply of bonds
  • supply of loanable funds, or savings, comes from households, firms, the government, and foreign sectors
    • supply of loanable funds is also demand for bonds
Change in Demand for Loanable Funds :

  • demand for loanable funds equals more borrowing (supplying of bonds)
    • more borrowing = more demand for LF (  )
    • less borrowing = less demand for LF (  )
  • ex : government deficit spending = more borrowing = more LF
  •        less investment demand = less borrowing = less demand LF
Change in Supply of Loanable Funds :
  • supply of LF = savings ( ex : demand for bonds )
  • more savings = more supply of LF (  )
  • less savings = less supply of LF (  )
  • ex : government budget surplus = more saving = more supply of LF  ( SLF → r % ↓ )
  •        decrease in consumers MPS = less savings = less supply LF ( SLF  r %  )
- Loanable Funds Market determines real interest rate
 in real interest will affect Ig
- when the government does fiscal policy, it will affect the LF Market
 in savings/borrowing creates a  in → r  % 
LF Market relates savings and borrowing

Wednesday, March 25, 2015

Federal Fund and Prime Rate

- interest rate that commercial banks charge other commercial banks for overnight loans

Two Options :

  1. discount rate , borrow from the government
  2. borrow from neighboring bank ( sister bank )
    • federal fund rate
Primate Rate
- interest rate that is given to a bank's most credit worthy customers
  • good credit, good interest
  • bad credit, higher interest
  • ideal : 0 - 4 %

Policy Summary and Countercyclical Options

Recession :

An efficient "full employment" economy will probably have

  • an annual unemployment rate of 4 - 5 %
  • an annual inflation rate of 2 - 3 %
If the economy goes into a recession
  • the real GDP will decrease for at least 6 months
  • the unemployment rate will go up to 6 % or more
  • the inflation rate will go to 2 % or less
If Congress enacts Keynesian Fiscal Policy to attempt to slow or stop the recession, then
  • the policy will try to improve C or G ( parts of AD )
  • Congress will cut federal taxes
  • Congress will increase jobs and spending programs
  • the federal budget will create a deficit
  • due to changes in Money Demand, interest rates will increase
    • ( crowding out might occur, but Keynesians don't care )
If the Federal Reserve employs Monetary Policy options to slow or stop the recession, then
  • the policy will target improvement in Ig ( part of AD )
  • the FED will target a lower federal fund rate
  • the FED can lower the discount rate
  • the FED can buy bonds ( Open Market Operations )
  • the FED can ( theoretically ) lower the reserve requirement, but probably won't because it is too complex for the banks
  • the FED policies will lower the interest rates through changes in the Money Supply
  • these options should increase Ig

Inflation :

If the economy suffers from too much demand-pull inflation then
  • the unemployment rate will go to 4 % or less
  • the inflation rate will go to 4 % or more
If Congress enacts Keynesian Fiscal Policies to attempt to slow or stop the inflation problems,
  • the policy will try to decrease  C or G ( parts of AD )
  • Congress will increase federal taxes
  • Congress will decrease jobs and spending programs
  • the federal budget will create a surplus
  • due to changes in Money Demand, interest rate will decrease
If the Federal Reserve employs Monetary Policy options to slow or stop the inflation problems, then
  • the policy will target decreases in Ig ( part of AD )
  • the FED will target a higher federal fund rate
  • the FED can increase the discount rate
  • the FED can sell bonds ( Open Market Operations )
  • the FED can ( theoretically ) raise the reserve requirement, but probably won't because it is too complex for the banks
  • These FED policies will increase the interest rates through changes in the Money Supply
  • These options should decrease Ig

Tools of Monetary Policy

Fiscal Policy

  • controlled by Congress and the President
    • tax created by spending
Monetary Policy
  • controlled by the FED and the federal reserve bank
    • Open Market Operation
    • Discount Rate
    • Federal Fund Rate
    • Reserve Requirement
Monetary Policies
  • Open Market Operations ( OMO )
    • to buy or sell securities ( bonds )
    • Expansionary ( recession, "easy money" )
      • buy bonds
      • money supply would increase
    • Contractionary ( inflation, "tight money" )
      • sell bonds
      • money supply would decrease
  • Discount Rate
    • interest rate that the FED charges banks for taking out loans
    • Expansionary
      • decrease in interest rate
    • Contractionary
      • increase in interest rate
  • Reserve Requirement
    • percentage or amount the bank has to hold and keep in reserve
    • Expansionary
      • decrease in required reserves
    • Contractionary
      • increase in required reserves
Scenarios to use for help :
FED Actions and Their Effects
  1. Sold treasury securities on the open market
    • Bank reserves would decrease
    • Money supply would decrease
  2. Bought treasury securities on the open market
  3. Bank reserves would increase
  4. Money supply would increase
  5. Raised discount rate
    • Bank reserves would decrease
    • Money supply would decrease
  6. Lowered discount rate
    • Bank reserves would increase
    • Money supply would increase
  7. Raised reserve requirement
    • Bank reserves would decrease
    • Money supply would decrease
  8. Lowered reserve requirement
    • Bank reserves would increase
    • Money Supply would increase

Money Market

- demand for money has an inverse relationship between nominal interest rate and quantity of money demanded

Money Demand Shifters :
  1. ∆ in PL
  2. ∆ in income
  3. ∆ in taxation that affects investment
- demand is always downward sloping

- FED increases Money Supply , temporary surplus of money will occur at 5 % interest

- Fed decreases Money Supply , temporary shortage of money will cause interest rate to rise to 10 %

Key Principles

- a single bank can create money ( through loans ) by the amount of excess reserves

- the banking system as a whole can create money by a multiple ( deposit or money multiplier ) of the initial excess reserves

- banks loan out all of their excess reserves

- loans are redeposited in checking accounts rather than taken in cash

Initial Deposit : Cash

  • the only use of money created by the banking system
  • Existing Money
  • Bank Reserves , Income ( Liability )
  • Immediate Change in Money Supply ?
    • No, because the composition of money changes
Initial Deposit : FED Purchase of a Bond from the Public
  • New Money
  • Bank Reserves , Increase
  • Immediate Change in Money Supply ?
    • Yes, because money coming from the FED is new money in circulation
Initial Deposit : Bank Purchase of a Bond from the Public
  • New Money
  • Bank Reserves , Increase
  • Immediate Change in Money Supply ?
    • Yes, because money coming out of the bank reserves is new money
- Both FED and bank purchase of  bonds from the public can use initial deposit and money created by the banking system

Factors that Weaken the Effectiveness of the Deposit Multiplier :
  1. if banks fail to loan out all of their excess reserves , this will cause the multipliers to be weak
    1. Ex : FED can change the numbers of monetary multipliers
  2. if bank customers take their loans in cash, rather than in new checking ( or checkable ) deposits, this creates cash or currency drain

Tuesday, March 24, 2015

Liabilities and Assets

  • Bank Balance Sheet = Assets and Liabilities in a T-Account
  • Liabilities = DD + Owner's Equity ( Stock Shares )
  • Assets = RR , ER , Bank Properly , Securities , Loans
  • Assets must equal Liabilities
    • DD = RR + ER
  • Money is created through the Monetary Multiplier
    • ER x 1 / RR ( multiplier )
    • this equals New Loans throughout the banking system
  • Money Supply is affected ...
    • cash from a citizen becomes DD , but does NOT change the Money Supply
    • ER from this cash becomes "immediate" loan amount
  • ER x Multiplier become
    • new loans and DD changes the Money Supply
  • The FED buying bonds
    • creates new loans and changes the Money Supply
  • IF the FED buys the bonds
    • on the open market, this becomes a new DD amount
  • IF the FED buys bonds
    • from the account already held by a particular bank, then the amount only becomes new ER
  • Bonds
    • bond "prices" move opposite to the changes in interest rates
      • the higher the interest rate will push bond prices down ( less money supply )
      • the lower the interest rate will push bond prices up ( more money supply )
Three Types of Multiple Deposit Expansion Questions :
  1. Type 1 
    • Calculate initial change in excess reserves
      • aka , the amount a single bank can loan from initial deposits
  2. Type 2
    • Calculate change in loans in the banking system ( money multiplier )
  3. Type 3
    • Calculate change in the money supply
      • sometimes Types 2 and 3 will have the same results
      • ex : no FED involvement
  4. Type 4
    • Calculate change in demand deposits
      • cash, checking account
Liabilities :
  1. Cash deposits from the public = DD
  2. Owner's Equity or Stock Shares = values of the bank stocks as held by the public
Assets :
  1. Required Reserves = the percentage of DD in the Vault = RR
  2. Excess Reserves = the remaining % of DD , used for loans = ER
  3. Banking Property Holdings = usually a statement of the bank's property values
  4. Securities = previously purchased bonds held by the bank as investments
  5. Customer Loans = previously loaned funds now owed back to the bank
REMEMBER THAT DD = RR + ER

Bonds can move in two ways
  1. the FED sells to the banks and increases the amount
  2. the FED buys from the banks and decreases the amount
Banks and the Money Supply
- the money multiplier process creates new money for the economy
  • Scenario # 1 :
    • A private citizen takes cash that they possess and put it into a bank account
      • The cash placed into the bank is already part of the money supply
      • the deposit is counted as a bank liability
      • a percentage must be placed into required reserves
      • the remainder is placed into excess reserves
      • the bank will want to lend all of the excess reserve , if possible
      • the amount in excess reserve is multiplied by the multiplier
      • this will be assumed to become new loans in the banking system
      • this will be counted as the change in the money supply
  • Scenario # 2 :
    • the FED buys bonds back from the public
      • the public now has new cash
      • this new cash is new loans
      • assume that the public puts the cash into demand deposits
      • a set percentage is placed into required reserves
      • the remainder becomes excess reserves
      • excess reserves are multiplied by the Money Multiplier ( 1 / RR )
      • this amount becomes new loans and is new money supply
      • the total change in the Mooney Supply is the amount of demand deposits plus the new loan amounts
  • Scenario # 3 :
    • the FED buys bonds back from the member banks
      • the bank now has new excess reserve
      • no money is needed to be placed into required reserves , since this is not owed to the public
      • all of these excess reserves are multiplied by the multiplier
      • this amounts becomes new loans
      • this amounts is the change in the money supply
Cause and Effects of the Money Supply :
  • changes in the MS will move the supply line on the Money Market Graph
  • changes in the MS will change nominal interest rate
  • changes in the MS can create inflation or dis-inflation
  • change in inflation can change real wages
  • changes in inflation rates also affect the international currency markets
  • changes in interest rates affect the prices of bonds in an inverse relationship

Multiple Deposit Expansion and the Federal Reserve

Seven Functions of the FED
  1. issues paper currency ( produced daily )
  2. sets up reserve requirement and holds reserves of banks
  3. lends money to banks and charges them interest
  4. checks clearing service for banks
  5. acts as a personal bank for the government
  6. supervises member banks
  7. controls money supply in the economy

Banks and the Creation of Money

  • How do banks "create" money ?
    • by lending out deposits that are used multiple times
  • Where do the loans come from ?
    • from depositors who take cash and place it in their banks
  • How are the amounts of potential loans calculated ?
    • using a bank balance sheet or a T - account that consists of assets and liabilities for the bank
  • Bank Liabilities ( right side of T-Account Sheet )
    • what you owe
    1. Demand Deposits ( DD ) or checkable deposits
      • cash deposits from the public
      • liability because it belongs to the depositors
    2. Owner's Equity ( stock shares )
      • values of stocks held by the public ownership of bank shares
  • Key Concepts of Liabilities
    • demand deposit comes from someone's cash holdings, then DD is already part of the money supply
    • DD comes in from purchase of bonds ( by the FED ) , this creates new cash and therefore creates new money supply ( MS )
  • Bank Assets ( left side of T-Account Sheet )
    • what you own
    1. Required Reserves ( RR )
      • percentages of demand deposits that must be held in the vault so that same depositors have access to their money
    2. Excess Reserves ( ER )
      • source of new loans
      • the amount applied to the Monetary Multiplier or the Reserve Multiplier ( DD = RR + ER )
    3. Banking Property Holdings ( buildings and fixtures )
    4. Securities ( Federal Bonds )
      • bonds purchased by the bank or new bonds sold to the bank by the Federal Reserves Bank
      • bonds can be purchased from the bank, turned into cash that immediately becomes available as "excess reserve"
    5. Customer Loans
      • can be amounts held by banks from previous transactions, owed to banks by prior customers
  • Money Creation ( Using Excess Reserves )
    • banks want to create profit by lending ER and collecting interest
    • loans will go out into customer's or business's accounts
      • more loans created in decreasing amounts (because of RR)
    • rough estimate of number of loan amounts created by any first loan is the "money multiplier"
  • Monetary Multiplier ( aka )
    • Checkable Deposits Multiplier
    • Reserve Multiplier
    • Loan Multiplier
  • Formula :
    • 1 / RR = Monetary Multiplier
      • ex : RR = 10 %
      • 1 / .1 = 10
  • Excess Reserves are multiplied by the Multiplier
    • to create create new loans for the entire banking system
    • this creates new Money Suppyl

Investment

Investment
- redirecting resources that you would consume now for the future

  • Financial Assets
    • plans on property and income of the borrower
  • Financial Intermediaries
    • institution that channels funds from savers to borrowers
  • Relationship between the two : savers to institution to investor
Three Purposes for Financial Intermediaries :
  1. Share Risks
    • diversification, spreading out your investment to reduce risk
  2. Providing Information
    • stock broker to help you in the market
      • ex : facebook, teens attracted to it because of instagram
  3. Liquidity, easily converted to cash
    • Returns - money an investor receives above and beyond the sum of money that was initially invested
    • the higher the risk, the higher the return
Bonds
- loans or I.O.U.s that represent a debt that the government or corporation must repay to an investor
- generally low risk investment

Three Components : 
  1. Coupon Rate
    • interest rate that a bond issuer will pay to a bond holder
  2. Maturity
    • time at which payment to a bond holder is due
  3. Par Value
    • amount that an investor pays to purchase a bond at that will be repaid to an investor at maturity
Yield
- annual rate of return on a bond if the bonds were held at maturity
  • Bonds, YOU LOAN
  • Stocks, YOU OWN
Time Value of Money
  • Is the dollar today worth more than the dollar tomorrow?
    • Yes
  • Why?
    • Opportunity cost and INFLATION
Formulas :
  • v = future value of $
  • p = present value of $
  • r = real interest rate ( nominal - inflation rate ) [a decimal]
  • n = years
  • k = number of times interest is credited per year
  • Simple Interest Formula
    • v = ( 1 + r ) ^ n * p
  • Compound Interest Formula
    • v = ( 1 + r / k ) ^ nk * p
-Inflation expected at 3 %, nominal on simple interest is 1 %

Example Problems :
- Future Value of $1 After 1 Year :
  • 1 - 3 = 2 % ( real interest )
  • v = (1 + ( - 0.02 ) ) ^ 1 * 1 = $ 0.98
- Inflation 3 % , nominal 4 %
  • 4 - 3 = 1 % → 0.01
  • ( 1 + .01 ) ^ 2 * 1 = $ 1.01
- Inflation 2.5 % , nominal 5 % , years = 10 , future value = $1,000 , compound monthly
  • ( 1 + .025 / 12 ) ^ 10 ( 12 ) * 1000
  • ( 1 + 0.002083 ) ^120 * 1000 = $ 1,283.69
Monetary Equation of Exchange :
  • MV = PQ
    • M = money supply ( M1 or M2 )
    • V = money's velocity ( Mor M2 )
    • P = price level ( P on AS / AD )
    • Q = real GDP (Y on AS / AD )
How is Money created ?
  • by banks ( fractional reserve banking )
  • money is loaned into existence
  • when it is paid back, there is no more money

Money

Money is any asset that can be easily used to purchase goods and services

Use of Money :

  1. as a medium of exchange
    • used to determine value
  2. unit of account
    • something that will compare cost
    • ex : grocery shopping
  3. store of value
    • hiding money in a shoe box ( no interest )
    • bank ( interest )
Types of Money :
  1. Commodity Money
    • has money value within itself
    • ex : salt, olive oil, gold
  2. Representative Money
    • represents something of value
    • I.O.U ( pay back, paper is worthless )
  3. Fiat Money
    • money because the government says so
    • paper currency ( dollar / notes ), coins
"Currency is money, but money is not currency"
 Six Characteristics of Money :

  1. Durability - how long it can last
  2. Portability - can be taken anywhere
  3. Divisibility - can be broken down
  4. Uniformity - it all looks the same ( except with updated ones)
  5. Limited Supply
  6. Acceptability

Money is backed by Fiat Money


Money Supply :
- all of the available money in the economy
M1 Money :
  • Liquid assets ( Liquidity )
    • easily to convert to cash
      • currency ( paper )
      • coins
      • checkable deposits / demand deposits ( checks )
      • traveler's checks ( safe )
M2 Money :
  • consist of M1 Money + Savings Account + Money Market Account
    • Savings Account, not as easy to withdraw as M1 Money
    • Money Market Account, if withdrawn, you will be penalized from your own account
Three Purposes for Financial Institution :
  1. Store Money
  2. Save Money
  3. Loan Money
    1. for credit cards
    2. for mortgages
Four Ways to Save Money :
  1. through savings account
  2. through checking account
  3. through money market account
  4. through certificate of deposit ( CD )
  • Number 3 and 4, these way gives higher interest rate
Loans :
- banks operate on a fractional reserve banking system, which means they keep a fraction of the funds and loan out the rest
banks make money through loans
  • Interest Rate
    1. Principal - amount of money borrowed
    2. Interest - price paid for the use of borrowed money
  • Two Types of Interest :
    1. Simple Interest - paid on the principal
      • I = ( P * R * T ) / 100
        • P = Principal
        • R = Rate of Interest
        • T = Time
    2. Compound Interest - paid on the principal and accumulative interest
  • Formulas :
    • Time = ( I * 100 ) / P * R
    • Principal = ( I * 100 ) / R * T
    • Interest Rate = ( I * 100 ) / P * T
Types of Financial Institutions :
  1. Commercial Banks
  2. Savings and Loans Institutions
  3. Mutual Savings Bank
  4. Credit Unions
  5. Finance Companies