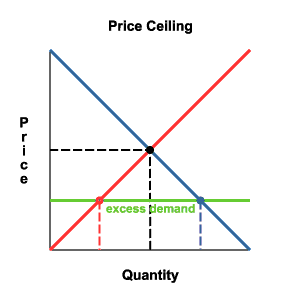
Graph shows the relation between Supply and Demand:
- Equilibrium - it is the point at which the supply curve and the demand curve intersect
- means all resources are being used efficiently
- Shortage - QD > QS
- Quantity of demand is greater than the quantity of supply
- excess demand
- SURPLUS - QS > QD
- Quantity of supply is greater than the quantity of demand
- excess supply
Graph shows a Price Floor


This is a very nice blog overall! I enjoy looking over and refreshing myself on these notes because everybody catches something different whenever they take notes. I enjoy the graphics that you include as well as the concise information that you post. Keeping it short and to the point will be a ton of help to whomever visits your blog! Take care.
ReplyDeleteThanks! I'm glad my blog was of help to you! :')
ReplyDelete